Vollständiges Transkript von „Everyone Laughed at His Strategy (Until He Dominated the World Cup 12 Times)“. Klicke auf einen Zeitstempel, um das Video an dieser Stelle zu öffnen. Du brauchst ein anderes Video? Nutze den YouTube-Transkript-Generator.
0:00 This is Patrick Nill. For most of his life, he was a bookbinder. He ran his family company in a small town in Germany, working 16 hours a day. Then in 2018, he sold everything to become a full-time trader. His parents said he was going to the casino. His friends called it gambling. One year later, his name was on the leaderboard of the Robbins World Cup, the oldest and most famous trading competition on the planet. And he never left. Patrick has finished in the top five of that competition 12 times. This year, he is in first place with a return of around 300%. Yes, you heard me right, 300%. That's insane. And here's the part that
0:46 nobody expects. Patrick does not sit in front of six screens all day. He says one hour in the morning is enough. He looks at the chart, places his one or two trades, and the day is over. Sometimes he does it from his phone while traveling because the strategy that made him a world champion is incredibly simple, simple enough that anyone can understand it. It's built on one single idea about how markets move. And once you see it, you can't unsee it. Now, if you're like me, you're thinking, how does he do it? Well, I decided to look for the answer. I went through every interview Patrick has ever given, hours and hours of him drawing on charts and explaining his model. And I have to say, this man is a genius of simplicity.
1:33 I condensed everything into this video, and I'm giving it to you for free. So if this adds value to your trading, hit that like button and drop a thank you in the comments. It really helps the channel grow. Let's get straight to it. Before we go to the strategy itself, you need to understand the three principles Patrick built his entire career on. The first principle is this. Markets spend about 70% of the time in ranges and only 20 or 30% of the in trends. And there's a reason for it. Big players need liquidity to fill their orders. Inside a range, they can do that. When the liquidity dries up, they push price to one side toward the next pool of liquidity and a new range forms there. So the job of a trader is not to predict. The job is to move from one
2:20 area of fair value to the next one. The second principle is the one Patrick calls his biggest rule. You never move your stop loss to give the trade more room. Never. When you're nervous and price comes close to your stop, you want to push it a bit further away. Patrick says that the moment you do this, you cannot be profitable anymore. It's a red flag. He learned this the hard way. During COVID, oil kept failing. When it was around $12 or $13 a barrel, Patrick and his team thought it was way too cheap. For years, it had cost 10 times that, so it had to go back up. They bought. When it fell to 10 and then to eight, they bought more. At five, they bought again. They were breaking all of
3:06 their own rules, but they thought it was the deal of a lifetime. Then they stopped for a second and asked themselves what the real risk was. They closed everything that same day and pulled the plug. That night, oil went to -$40. Nobody knew oil could go negative. They had calculated a maximum risk of a few thousand dollars per contract. The real risk was almost 10 times that. Since that day, Patrick's stop loss is untouchable. And the third principle follows from the second. You decide the stop loss first based on the structure of the market. Only after that you decide how many contracts to trade. Sometimes the stop is small, sometimes it is big, and the position size adapts
3:51 to the stop, never the other way around. Now that the foundations are clear, let's see how Patrick actually reads a chart. Everything in Patrick's model starts with two letters, P and B. A P is a strong move up followed by a range. A B is a strong move down followed by a range. That's it. You wait for the push and after the push almost every time price starts moving sideways. That range is Patrick's playground. The time frame where he makes his decisions is the 15-minute chart. He uses the 4-hour chart to get the big picture and sometimes he drops to the 5 or 3-minute chart only to execute with more precision, but the decision is always made on the 15-minute. Now here's a question every trader gets
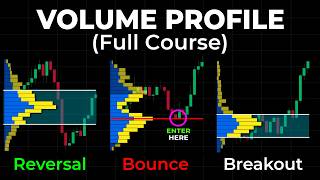
4:38 wrong. When does a range become a valid range? Patrick waits for three confirmations, three touches of the zone. You could call it a P much earlier after one or two touches, but Patrick waits very long on purpose because the longer the range, the higher the probability that the breakout actually works. Sometimes this means he misses the move completely. He's fine with that. On a 15-minute chart, a good P needs at least half a day to form, often a full day. So we are not talking about 20 trades a day. We're talking about one or two good setups. And before drawing the zones, when Patrick is at his desk, he looks at the market profile and the volume profile of the week. The value
5:24 area high and the value area low tell him where the market is in balance and where price will move fast because there's almost no volume. If a P or a B forms exactly on one of those levels, the setup is much stronger. Once you have a valid range, there are three ways to trade it and Patrick uses all three. The first one is the range trade. You place a limit order at the bottom of the zone and target the top or you sell the top and target the bottom. No partials, just in and out. Patrick loves it when two ranges sit at the same price level because he says they simply work better. He does not open range trades when the P is completed in the evening because 8 hours without seeing the market is too long. The second one is the breakout with
6:11 confirmation. Patrick does not buy the first candle that leaves the range. Too many breakouts are fake. He waits for a candle to close outside the zone, then price comes back to test the edge of the zone, and the next candle closes beyond the breakout candle. That is his confirmation. On the downside, it is the same logic, a new low, a pullback, and then the break of that low. Only then he enters, usually with a limit order. The third one is his favorite trade in the world. Price breaks below the range. The sellers push, but they do not have enough power. Price comes back inside the zone. Patrick goes long right there. The stop is tiny, just below the low of the fake breakout, and the potential is
6:56 huge because when the market wanted to go down and failed, it often moves up with force. In this case, he does not stop at the top of the range. He holds. He prefers this setup on the long side. The mirror image of fake breakout above the range and a return inside, he trades much less because when there is power to the upside, more power usually comes. With the entries clear, let's talk about where the trade ends. The stop loss goes below a structural low, below the zone, or on a level of the market profile. If there is nothing to lean on, Patrick calculates it from the target. If the target is far away, he accepts a wider stop as long as the risk-to-reward stays above three. And as the trade moves in
7:41 your favor and new ranges form, you move the stop below each new P, up and up, under every new area of fair value. For the targets, Patrick trades from fair value to fair value. If there's a previous range above or below, that's the target. When he has several contracts, he takes the first partial at the edge of the closest zone, decides the second one on the spot, and leaves the last contract for the origin of the whole move. He usually works with multiples of three contracts for this reason. What if the market is at an all-time high and there is no previous fair value? Then he measures the size of the initial impulse and projects it forward, one to one. And one last detail that makes a big difference. Small ranges after a big
8:28 move are perfect for breakouts. The stop is close, the target is far, and you can get a risk-to-reward of eight or more. Big ranges are perfect for range trading, but terrible for breakouts because the stop would be way too far. Now, before we go to the chart and trade this live, there is something you need to know. The hardest part of Patrick's strategy is not the entry. It's drawing the range right. Too early and you trade a range that's not finished. Too late and the move is already gone. Patrick himself admits that his exact rules for drawing and resizing the zones are the one thing he does not share. If you want help with that part, there's a free indicator on TradingView called Consolidation Zones Volume Delta by Flux
9:13 Charts. It finds the sideways areas after a strong push and draws the box for you. It also shows how buying and selling volume builds up inside each range so you can see which side is in control before the breakout comes. And if you want to go one step further, Flux Charts also has a paid tool, the Price Action Toolkit. It shows you market structure, liquidity grabs below and above the range, and key levels from higher time frames, all on one chart. If you decide to try it, use this code for 20% off. You'll find the link in my description. All right, let's get back to the video. Let's put everything on a real chart and trade it the way Patrick does. First things first, open TradingView. If you don't have it yet, I leave a link in my description. On this chart, I'm on the 15-minute time frame. I zoom out to the
10:00 4-hour first and I can see the market has been moving up. So the big picture is bullish. Back on the 15-minute, this is what I'm looking for. Here we have a strong push up, and after the push, price starts moving sideways. This is a P. I draw the zone from the high of the range to the low of the range. touch here, a second touch here, and a third touch here. Now the range is valid for me. Then this happens. This candle breaks below the zone. A beginner would sell this. I don't. I wait and look at the next candle. It closes back inside the range. The sellers tried and they failed. This is the trade Patrick loves most. I place a
10:46 buy limit order right at the lower edge of the zone, and my stop goes just below the low of the fake breakout. A very small stop. Price fills my order and starts moving up. I don't close at the top of the range because when the market wanted to go down and could not, it often goes up with force. My first target is the edge of the next fair value area above us. And look at this. A few candles later, and we're there. The risk to reward on this trade is incredible because the stop was tiny and the move was big. Now let's do a short. On this chart, I'm again on the 15-minute time frame. Same routine as before. I check the 4-hour chart first, and this time the big picture is not clear. The market made a strong push up and then it stopped. That is exactly
11:32 where Patrick likes to look for a counter trade. Back on the 15-minute, here's the impulse up. And right after it, price starts moving sideways. This is a P. I draw the zone from the high to the low of the range. First touch here, second touch here, third touch here. Now the range is valid. Then price breaks above the zone. A lot of traders would buy this breakout. I don't. I remember what Patrick said. No confirmation, no trade. So I wait and watch what price does next. And here it comes. Price fails to continue, comes back down to the upper edge of the range, and this candle closes back inside the zone. The buyers tried and they failed. This is my entry
12:17 for the short. I sell right at the upper edge of the zone with my stop just above the high of that fake breakout. Again, a very small stop. My target is the beginning of the impulse because according to Patrick, that is where price usually goes back to. And since there are two fair value areas between my entry and that level, I take a first partial at the lower edge of the range. I move my stop to break even and I let the rest run. Price drops through the range, keeps going, and reaches the origin of the move. Another trade with a small stop and a great risk to reward. So we have the two trades, the long and the short. But if the strategy is so simple, why is Patrick a world champion and most people
13:03 are not? He has a very clear answer. The difference between a profitable trader and a champion is consistency. A profitable trader can do it once. A champion does the same thing every day without changing the rules out of fear or greed. And he has a rule for bad days, too. After three or four losses in a row in the same day, he closes everything and starts fresh the next morning. Sometimes your head is just not in the market and it's better to go. Let's recap everything we learned from Patrick Neil. Markets spend most of the time in ranges and you trade from fair value to fair value. 4-hour chart for the big picture, 15-minute chart for the decision. A strong push followed by a range gives you a P or a B, valid only
13:51 after three touches. Three ways to trade it, the range trade, the breakout with confirmation, and the fake breakout with the reclaim. The stop goes on the structure. It is set before the position size and it is never moved to give the trade more room. Targets at the next area of fair value in partials or one-to-one from the impulse at new highs. and the psychological requirements, patience to wait for the third touch, discipline to close the day after three or four losses, the calm to do the same thing every day. A bookbinder with 16-hour days, laughed at by his own family, became one of the most consistent competition traders in the world with a strategy you can draw
14:37 with two letters. That's not luck. That is a method executed with discipline year after year. Thank you all for your support, and I just want to ask you to tell me in the comments which market you trade the most. I'm curious to know where you spend your time. See you guys next time.